


How to Find Your Gross Profit Margin in QuickBooks Online (Using the Profit & Loss Report)

Welcome to Know Your Numbers, our monthly series breaking down key business metrics: what they mean, why they matter, and where to find them in QuickBooks Online.
First up is Gross Profit Margin. This is the share of every sales dollar left after covering your direct costs. The best part? QuickBooks Online calculates it automatically in your Profit and Loss report.
This month’s question: are you actually making money on what you sell?
What is gross profit margin?
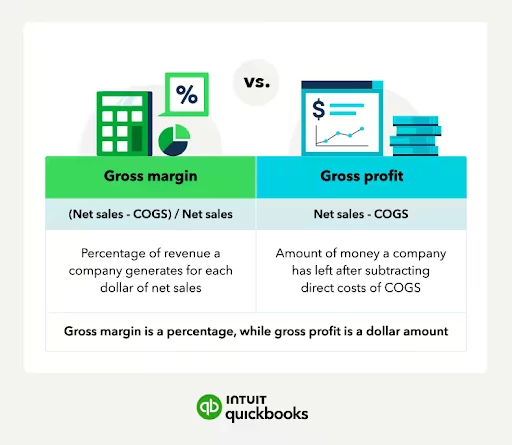
Gross profit is what's left of your sales after subtracting your direct costs, also known as cost of goods sold (COGS). Direct costs only exist because you made a sale: materials, inventory you resold, subcontractors, direct labor on a job, shipping to fulfill an order. Rent, marketing, and software subscriptions don't belong here. These represent overhead expenses, which enter the picture later (specifically as net profit margin, which we will address next month).
Gross profit margin turns that dollar figure into a percentage of your sales:
Gross Profit Margin = (Net Sales − Cost of Goods Sold) ÷ Net Sales × 100
Net sales is your total revenue minus returns, discounts, and allowances. If you rarely issue refunds, net sales and total revenue land in nearly the same place. If you do issue them, using total revenue will quietly flatter your margin.
The percentage matters more than the dollar amount because it travels well. You can compare it across months, across product lines, and against other businesses like yours.
Let's see it in action
Say you run a custom furniture shop. You billed $25,000 last month and refunded $1,000 on a returned piece, which leaves $24,000 in net sales. Your direct costs were $9,600 in lumber and hardware, $3,400 paid to a subcontract finisher, and $600 in delivery, for $13,600 of COGS.
Gross profit: $24,000 − $13,600 = $10,400
Gross profit margin: $10,400 ÷ $24,000 = 43%
So about 43 cents of every sales dollar stays with the business to cover rent, insurance, marketing, your own pay, and hopefully some actual profit.
Run a service business? Plenty of consultants, agencies, and trades have almost nothing sitting in COGS, so QuickBooks shows a gross margin close to 100%. That's not a sign that you're doing great. If you or your team bill time, or you hire subcontractors to deliver the work, those costs are direct. Until they're categorized as COGS, you can't tell a profitable job from an unprofitable one. Fixing that is your one move this month.
Where to find it in QuickBooks Online
Here's the good news: if your books are in reasonable shape, QuickBooks Online is already doing this math for you.
- Go to Reports and open the Profit and Loss report.
- Set the report period. Last month is a great place to start.
- Select Compare, then scroll down to the Calculations section and check % of income.
- Run the report.
Every line now shows its share of income, and the percentage next to Gross Profit is your gross profit margin. The COGS line shows exactly how much of each dollar your direct costs are eating.
Before you close the tab, do two things. Switch the columns to display by month and run it again, since a margin that has drifted down three months in a row is an early warning you would never spot in your bank balance. Then save your customization so it's waiting for you in your custom reports next month.
On QuickBooks Online Advanced?
You can put this on a dashboard instead of running a report every month. Go to Reports, then Performance center, where you can build up to 25 charts with one metric each. There's a quick-add chart that plots your gross profit margin against industry benchmarks, drawn from at least 30 businesses similar to yours in industry, revenue range, and location. Set your industry in the Performance center settings (the gear icon above the charts) so the comparison is meaningful. You'll need admin access, and the chart won't appear if QuickBooks doesn't have enough data yet for your industry and location.
So what's a good number?
There's no universal answer, and that's okay. Margins vary widely by industry: reselling physical goods runs lean, labor-heavy service work runs higher, and anything with a manufacturing step lands somewhere in between. A benchmark borrowed from a different industry won't tell you much.
Two comparisons actually matter.
- Your own trend. Pull twelve months side by side. Holding steady is fine and climbing is better. If sales rise while margin drops, use it as a helpful cue to review supplier costs and adjust your pricing accordingly.
- The overhead test. Take last month's gross profit in dollars and subtract your overhead: rent, insurance, marketing, software, admin wages, everything below the gross profit line. Is there enough left to pay yourself properly and still have something over? If not, your margin is too thin for your cost structure, whatever the industry average says.
If you want an outside comparison, the Advanced benchmark chart above is the closest match you'll get. Otherwise your trade association's data or your accountant's read across similar clients beats a figure from a public company thirty times your size.
Your one move this month
If you do nothing else, spend ten minutes making sure your direct costs are actually in COGS accounts.
This is the most common reason a gross margin can be deceiving. Materials and subcontractors sitting in ordinary expense accounts make your margin look wonderful. Overhead dumped into COGS makes it look terrible. Either way you're steering by a broken gauge, and unlike a pricing problem, this one is free to fix.
Click the Gear icon, select Products and services, and spot-check a handful of items to see whether the cost side points to a COGS account or a general expense account. Then skim your COGS accounts with one question in mind:
Would this cost exist if we hadn't made the sale?
If no, it belongs in COGS. If it would have shown up anyway, like rent or marketing, it's overhead. A little recategorizing can move your margin by several points.
If you trust your numbers, but don’t love your margin,, the levers are more concrete than "sell more":
- Price. The most powerful one, since even a small increase flows almost entirely into margin.
- Direct costs. Renegotiate with your suppliers, ask new ones to compete, or line up a second source.
- Mix. Run your sales by product or service, find your highest-margin work, and steer your energy there.
- Leakage. In service businesses, this is usually scope creep and unbilled hours.
Pick one lever, make one change, and check your saved report next month. Small steps add up fast.
That's the habit
Now it's your turn. Run the report and see what the numbers reveal for your business. If the results surprise you, that's this series doing its job. And if you notice that your books could use a little tidying up, rest assured that's completely normal. A big benefit of this exercise is simply gaining clarity on where a quick cleanup can help.
Next month on Know Your Numbers: net profit margin, or what's actually left after everything.
Helpful resources
- How to calculate gross margin for a deeper look at the formula and six ways to improve it
- Create charts to see your business performance for step-by-step setup of Performance center charts and industry benchmarks
- The Answer Room: Mid-Year Money Check-In for the twice-a-year version of this habit, covering your full books