
Get 50% OFF QuickBooks for 3 months*

Buy now
Switch to QuickBooks and 70% off for 3 Months
September 8, 2025
Solved

Year Over Year Income and Expense Graph Quickbook Desktop

  • September 8, 2025
  • 1 reply
  • 18 views

Can anyone tell me how to create a graph showing Income and Expenses year over year for the past 5 years

Best answer by EduardA

Hi MB6565,
 

The Income & Expense Graph only generates monthly data, even when spanning multiple years, so it can’t display yearly summaries directly.
 

As a workaround, you can export the Profit & Loss Standard report to Excel, and then create a customized graph using that data. Here’s how to set up the report to show income and expenses for the past 5 years:
 

  1. Go to Reports, then select Company & Financial.
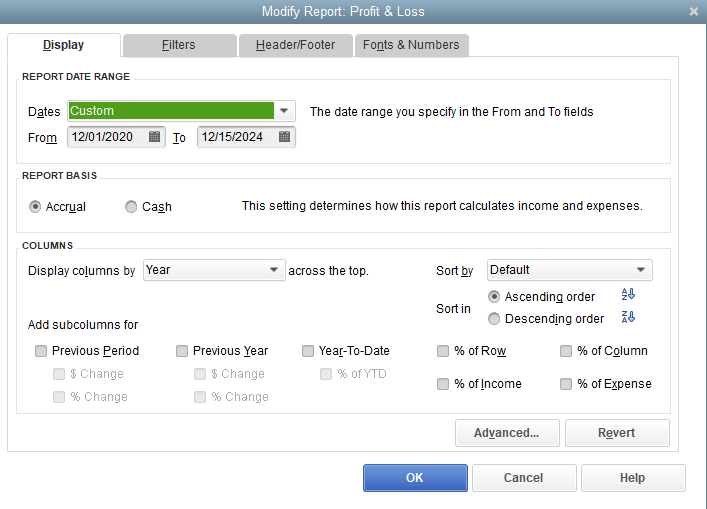
  2. Choose Profit & Loss Standard, then click Customize Report.
  3. Set Dates to Custom, and enter the From and To dates covering the last 5 years.
  4. Change Display columns by to Year, then click OK to apply.
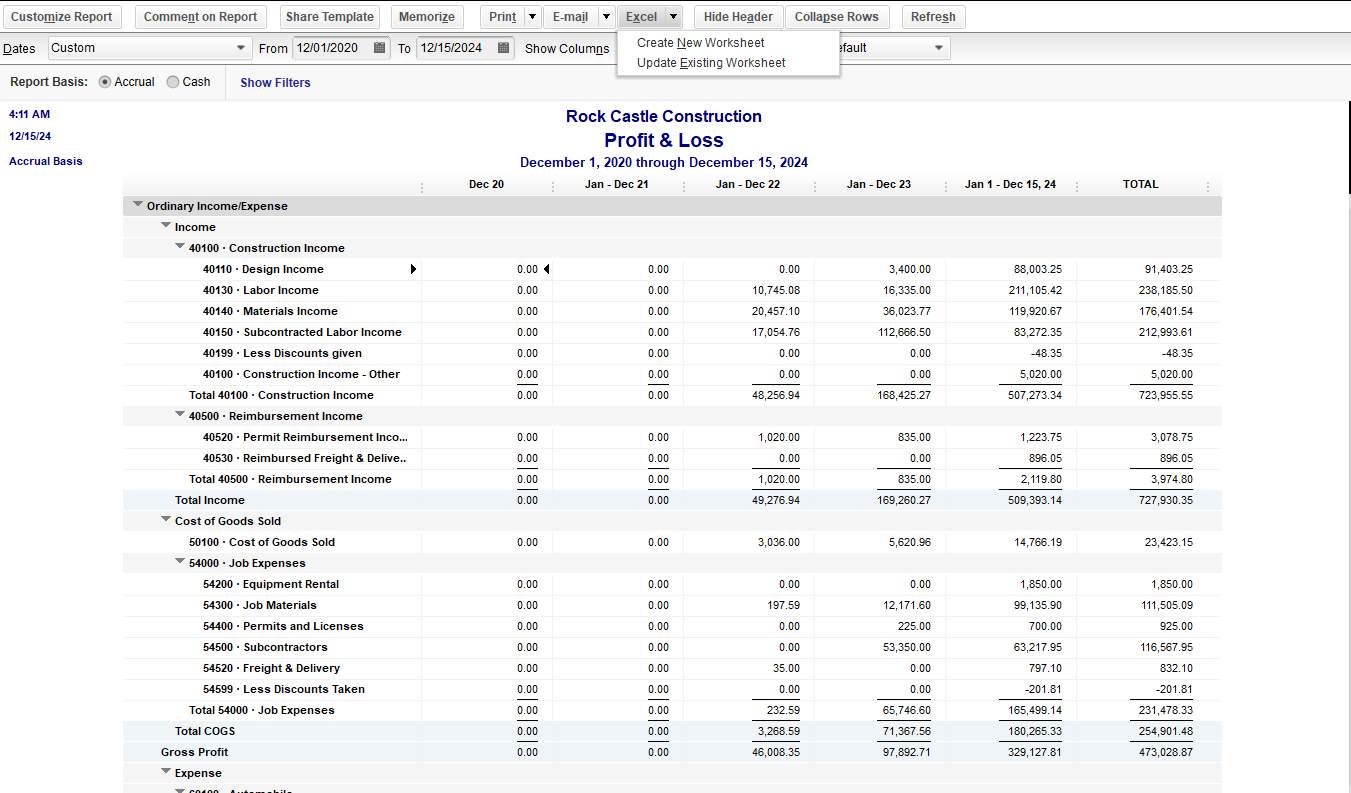
  5. Select the dropdown arrow next to Excel, then choose Create New Worksheet to export the report.


Once exported, you can then use Excel to create your own graph based on this data.
 

Feel free to share any other questions in the comments.

1 reply

EduardA
EduardAQuickBooks TeamAnswer
QuickBooks Team
September 8, 2025

Hi MB6565,
 

The Income & Expense Graph only generates monthly data, even when spanning multiple years, so it can’t display yearly summaries directly.
 

As a workaround, you can export the Profit & Loss Standard report to Excel, and then create a customized graph using that data. Here’s how to set up the report to show income and expenses for the past 5 years:
 

  1. Go to Reports, then select Company & Financial.
  2. Choose Profit & Loss Standard, then click Customize Report.
  3. Set Dates to Custom, and enter the From and To dates covering the last 5 years.
  4. Change Display columns by to Year, then click OK to apply.
  5. Select the dropdown arrow next to Excel, then choose Create New Worksheet to export the report.


Once exported, you can then use Excel to create your own graph based on this data.
 

Feel free to share any other questions in the comments.